Okay guys!! Good news. This is the last week of school, so these are our two last concepts that we are going over. First off is double bar graphs. Double bar graphs are similar to bar graphs that you have seen before, but each category is split into two. Look to the picture below to recognize the parts of a double bar graph.

in the case below, they surveyed boys and girls separately. This graph tells us lots of information. Look below for how to read that information:

If you look at this bar graph, you can see many things. For example:
- Swimming is the most popular activity for boys and girls. 35 boys, and 35 girls voted for swimming.
- More boys than girls liked to go canoeing (20 boys liked canoeing best, whereas only 15 girls liked canoeing best)
- A total of 90 girls voted (30 + 35 + 15 + 10 = 90 total)
- A total of 85 boys voted (25 + 35 + 20 + 5 = 85 total)
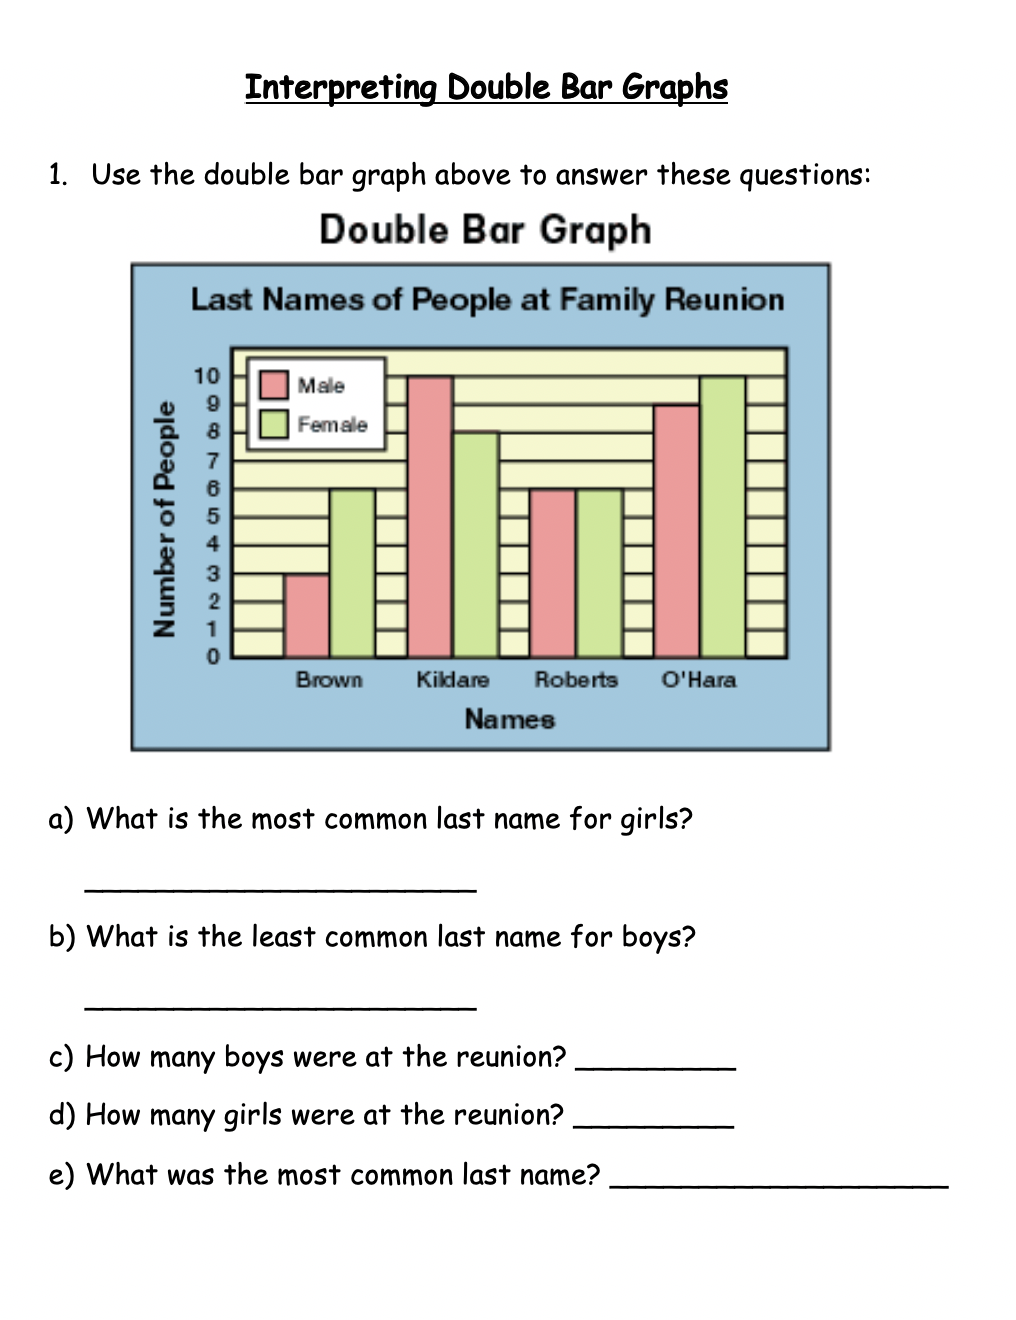
See how one graph can show you so much? Now, time to give reading these graphs a try. Complete the practice questions for the graphs below:
- Swimming is the most popular activity for boys and girls. 35 boys, and 35 girls voted for swimming.
- More boys than girls liked to go canoeing (20 boys liked canoeing best, whereas only 15 girls liked canoeing best)
- A total of 90 girls voted (30 + 35 + 15 + 10 = 90 total)
- A total of 85 boys voted (25 + 35 + 20 + 5 = 85 total)
See how one graph can show you so much? Now, time to give reading these graphs a try. Complete the practice questions for the graphs below:
|

|
| Interpreting Double Bar Graphs Practice |
There are a few things that you need to consider when constructing a double bar graph. First, is that you want to include all of the labels of a double bar graph:
- title of the graph (ie Favourite School Subjects)
- y- axis label (along the side. ie Number of Students who Chose Each )
- x - axis label (along the bottom. ie math, science, LA, social)
- key (ie purple - girls, blue - boys)
- scale (numbers on the side - be careful! They don't always just count up by 1, 2, 3, ... Sometimes you have to skip count by another number. In this case, they skip counted by 2)
Look at the example below to see how I labelled the graph:

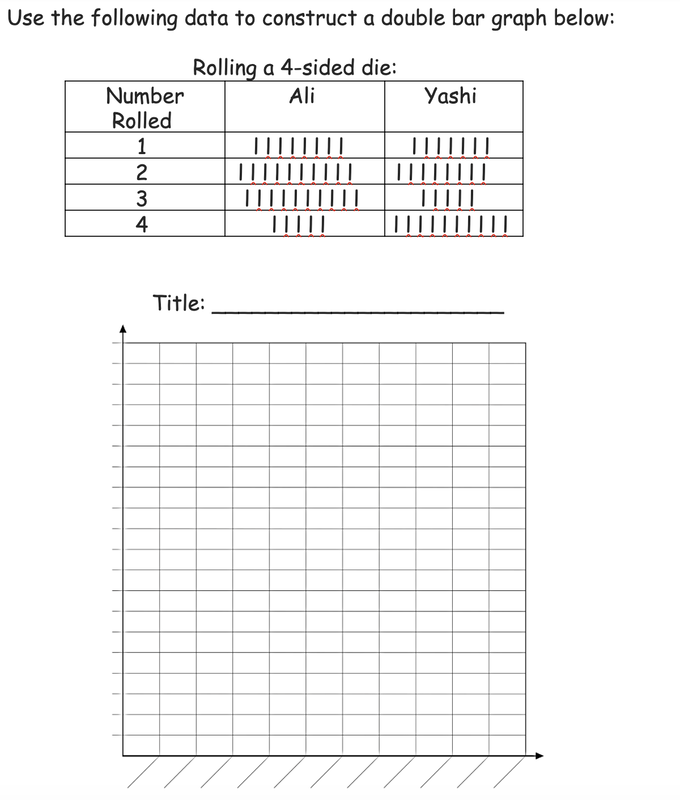
See how that works? Now if you were creating this graph, you would fill in the two colours for the remaining subjects as well (science, social, LA). I want you to try to make your own double bar graph using the data given below. A printable version is attached on the bottom.
| construct_double_bar_graph.docx |
Great job on your double bar graphs! Now ready for the LAST outcome you will learn in math for grade 5? It is time to talk about... Probability!
Probability is the likelihood that something will occur. There are 5 words that we use when looking at probability:
Possible
Impossible
Certain
Likely
Unlikely
Possible
Impossible
Certain
Likely
Unlikely
|
Let's look at this picture to practice using those words:
It is possible you will pull a red marble It is impossible you will pull a green marble. It is certain you will pull a red or a blue marble. It is likely you will pull a blue marble. It is unlikely you will pull a red marble. |

|

|
Let's look at this picture to practice using three new words - less likely, equally likely, and more likely.
It is less likely that you will spin a 4 than a 5. It is equally likely that you will spin a 1 as a 5. It is more likely you will spin a 3 than a 2. Can you think of more statements that you can make looking at the spinner to the side? |
Okay, time to practice!

|

|
| The Language of Probability |
